Experience
Projects
ASU Projects , I built for Institutional Analytics (2022-2025)
(All of my work below displayed are anonymized, hashed data. No confidential, personally identifiable data from students, staff, or faculty is included in the images or videos)


As a part of my Final Semester Applied Project, I am collaborated with Dr. Ruth Wylie and her team in Arizona STEM project to understand the data trends in AZ educational dataset answering 6 Research Questions.
The visualizations will enable to help 500+ AZ educators across 100+ AZ Schools to improve their curriculum and also help professional organizations to promote more teachers in STEM field.
Moreover, the data also helps with solutions on student engagement and participation.

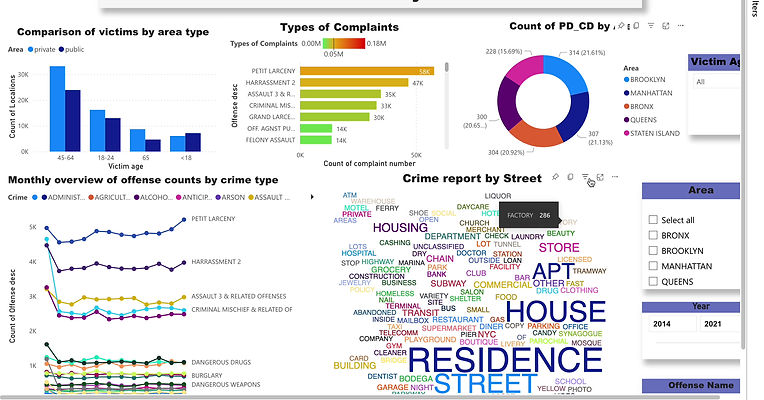
Created an interactive Tableau and PowerBi dashboard with 9+ visualization charts, a storyline for NYC providing comprehensive analysis of crime trends in various locations over the years. Includes boroughs and neighborhoods categorized into Safest, Safe, and Not Safe. Potential for use by NYPD and FBI to combat crime trafficking.
• Undertook a comprehensive analysis of Netflix movies and shows using Tableau, focusing on various aspects such as ratings, content distribution, viewership by country, and top genres. This project demonstrates my proficiency in data analysis and visualization, as well as my ability to derive meaningful insights from complex datasets

• The art is made with mathematical concepts of symmetry using p5.js library of Javascript.

• Created this user interactive moving triangle to understand the concept of triangles using the p5 library.
